Setting up pipeline failure alerts in Azure Synapse Analytics
If you have scheduled pipelines running in your Synapse Analytics workspace, chances are you are very interested in learning if these fail for whatever reason.
If you don’t take action to correct pipeline issues, this could lead to potential data loss and failing pipeline activities could be blocking important downstream activities as well.
In order to minimize potential downtime, here’s two approaches to setting up pipeline alerts for Synapse Analytics:
- Set up alerting within your Synapse pipeline
- Alerting using Log Analytics
Set up alerting within your Synapse pipeline
The most straightforward approach to setting up alerting, would be to simply add an activity within your Synapse pipeline itself, to take care of the job. Consider the following pipeline:
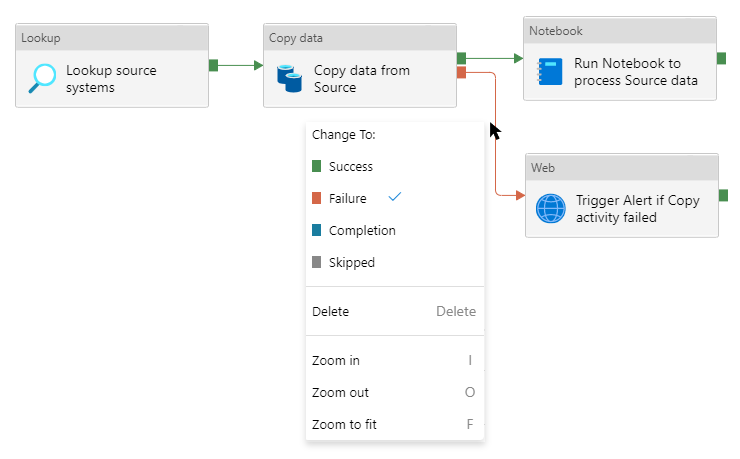
If the Copy data activity fails, the Web activity will be triggered. By right-clicking on a link between activities, you can choose when each activity should be run. In this case we set this to Failure, so the Web activity can make sure to send alerts via the correct channel (E-mail, Slack, etc.).
This approach is straightforward, but setting up alerting this way can clutter your pipelines with notification activities and it requires discipline to remember to set up alerting when making additions to the pipelines. Therefore, we can take a more holistic approach using Log Analytics.
Alerting using Log Analytics
Synapse Analytics can be configured to save log information about pipeline runs to Log Analytics. We can use this log information to set up automatic alerting if pipelines are failing.
For this approach, we’ll need do the following three things:
- Create a Log Analytics workspace to store your logs
- Save Synapse pipeline run information to Log Analytics workspace
- Set up alerting based on log information
To set up your Log Analytics workspace, navigation to the Azure Portal and search for Log Analytics Workspaces. Click “Create”, choose or create a fitting Resource group, and fill in the following:
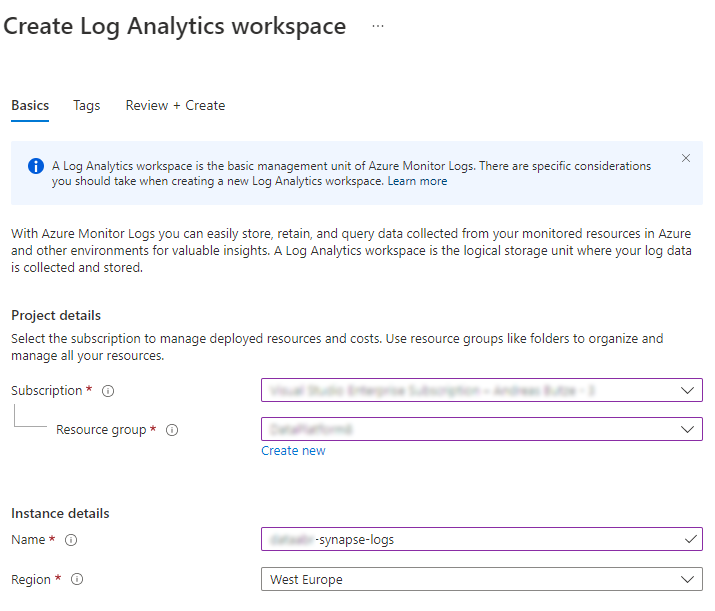
Continue “Review and Create” tab and deploy your resource. I’m using the Pay-as-you-go pricing tier.
Now that you have a shiny new Log Analytics workspace, we can configure Synapse to save log information to this workspace. To do that, navigate to your Synapse workspace resource inside of the Azure Portal. On the left navigation pane, click on “Diagnostic settings” under the Monitoring section.
In order to start collecting data, click on “Add diagnostic setting” and configure your log settings:
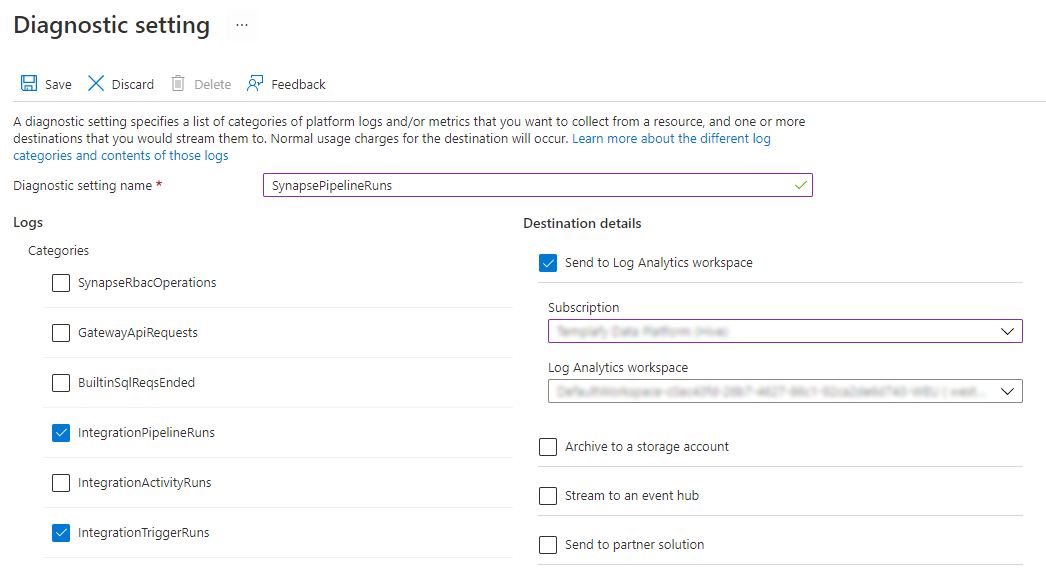
Select the log categories you would like to collect. I have selected IntegrationPipelineRuns and IntegrationTriggerRuns, since I’m interested in both pipeline runs and which triggers have been run.
In your Destination details, select the newly created Log Analytics workspace and save your changes.
Now that you have log information flowing between your Synapse pipelines and Log Analytics, we can configure the alerting 🎉
First let’s navigate to the Log Analytics workspace. Click on “Logs” in the General section. On the left side of the query editor, you should see your selected log categories: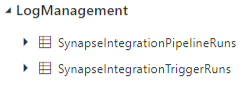
I’m interested in setting up a rule to alert me if my Main pipeline has failed, and to do that, I’ll use the following Kusto query:
Note that I’m using the SynapseIntegrationPipelineRuns table to return log information about recent pipeline runs. If you don’t have a requirement to narrow the returned logs to one specific pipeline, then you can remove the OperationName startswith '' section.
Run the query and then click the “New alert rule” in the query editor.
The “Scope” section will show your Log Analytics workspace. Under Condition, click the Condition name to alter it.
You should see that the Search query is already populated with the query we entered before. I configure my alert logic to be triggered if the number of results are greater than 0 - that means we have had a pipeline failure. In my evaluation settings, I set the period to 30 minutes and the frequency to 30 minutes (you can set this to a smaller interval, if you need to run checks for failing pipelines at a more frequent rate):

In the Actions section, click ‘Add action groups’. Select an existing action group or click the ‘Create action group’ button. Make sure to select the appropriate resource group for your action group and give it a suitable name.
In the Notifications tab, set up the type of notification you would like to receive (I simply opted for ‘Email’). In the Notification type dropdown, select ‘Email/SMS/Push/Voice’ and in the right menu pane, check ‘Email’ and enter the recipient e-mail address for the alert.
After adding your notification, skip to the “Review + create” section and deploy your action group.
You will be taken back to the alert creation page, where the Alert rule details must be filled out:
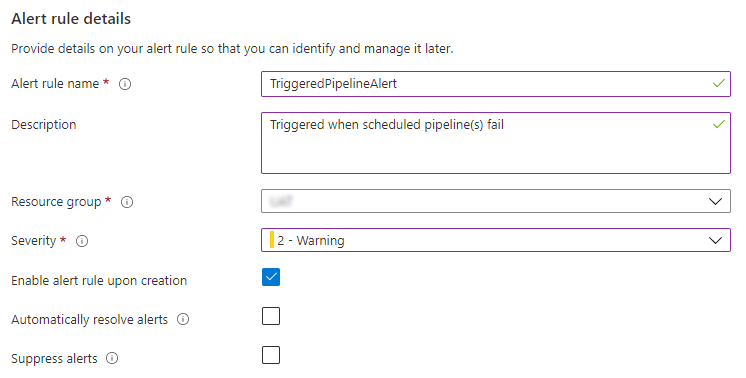
After this final step, click the Create alert rule button. Your pipeline runs are now actively monitored by Log Analytics. You can navigate to the Log Analytics workspace and select ‘Alerts’ in the Monitoring section in order to see an overview of configured alerts.
Going forward, Log Analytics will evaluate the defined query above every 30 minutes to check for failing pipelines, and if any are found, an email will be sent with a notification to the recipients defined in the action group.
Comments
Is the log analytics approach better than using SAS's internal alerts functionality?